ESP-32 Flight Datalogger – Rise Above It
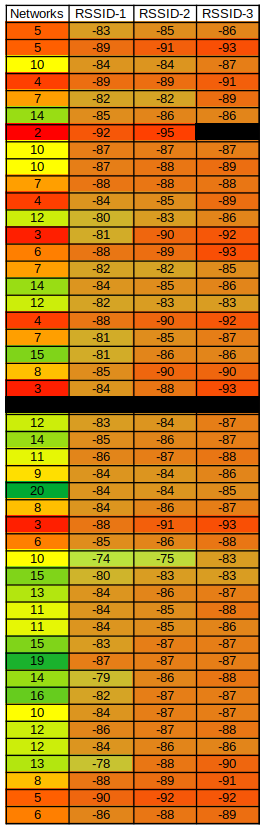
The data gathered from the flights revealed some interesting things. The first was that the amount of detected networks increased with elevation. The two flight locations weren’t close to any dense residential areas. At ground level, those networks were limited to the immediate area. However, once in the air, that number increased because they were now line of sight. The data logger also captured the three strongest networks detected, along with their RSSI values.
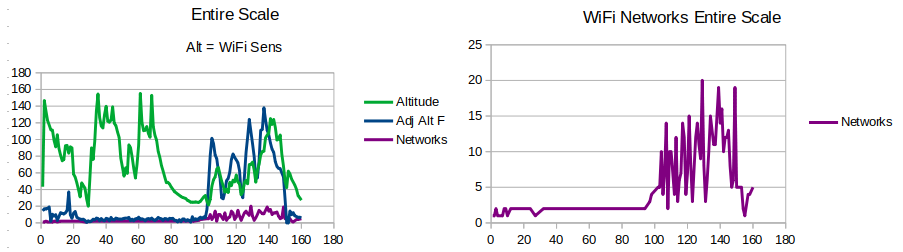
Although the network numbers increased, the RSSI values were still relatively low and not a source of concern regarding interference. The RSSI value for a given network could be heat mapped to create a footprint which was something not planned for with the design of the system.
The temperature sensor showed that while on the ground, the system heated up, but not to any alarming amount. Once in the air, the temperature stabilized to the ambient temperature. The barometric sensor had hard coded calibration values programmed into it. For this reason, they had a level of error that had to be corrected post flight. The method involved taking a sampling of ground readings and averaging them to the known height. Then that correction was applied to the readings to reflect the actual height. The values were compared with the GPS and the closely matched. The GPS did have some noticeable drift and didn’t’ appear to have the same accuracy as the barometric sensor.
Some other data processed from the readings were the sampling rate, distance traveled between readings, and the speed of the plane in feet per second. This served to better understand the limits imposed by the sampling rate.
The next section will cover the next flights that didn’t go as planned and the workaround used to get more interesting readings.