Sensor Presentation
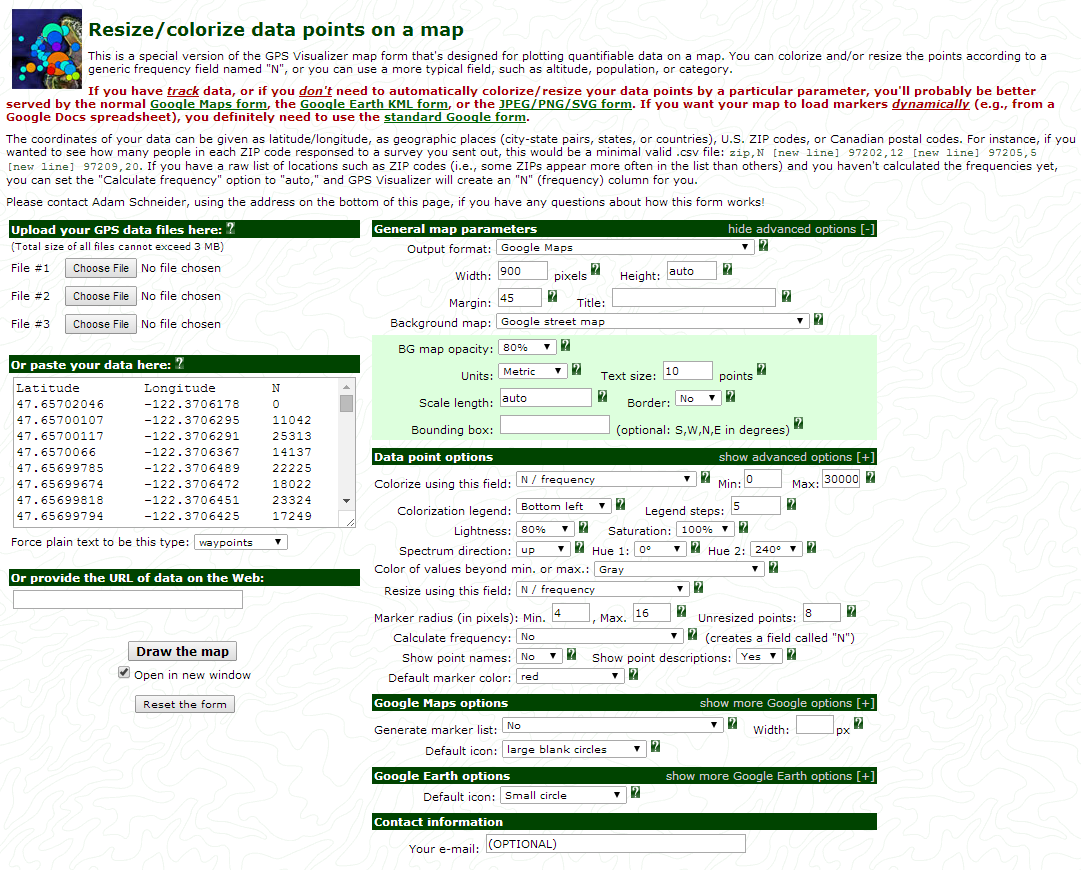
This site has been known to me for a while. I originally had found it in my search for ways to convert Google Map routes to a GPX file that would load in TopoFusion. The site is so feature rich that I skipped past it. I returned a few more times since then, but hadn’t found any compelling reason to look into it further. This changed with Hazim Bitar‘s Android App “SensoDuino“. The tutorial he presented helped put the pieces together.
This was the feature I was looking for in TopoFusion. All this time, here it was, already there. So I went ahead and stepped through the tutorial and in not time had my plot.
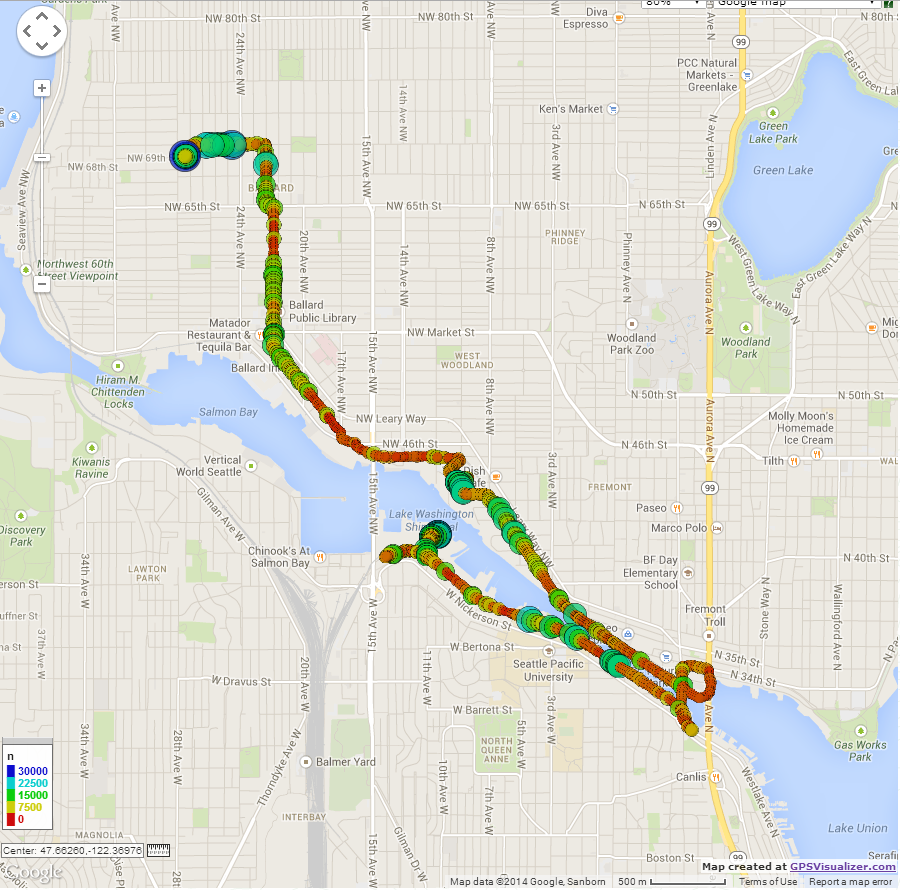
This is a plot of the varying sound levels during a ride home from work. The red is low readings, while the blue are high level readings. The turn around on the plot isn’t as fast as I’d like. It would preferable to automate it. But still, this was impressive.
Test results of preset readings from following Android Apps (Best to Less)
AndroSensor – https://play.google.com/store/apps/details?id=com.fivasim.androsensor
This one shined above the rest. The app’s only shortcoming was the absense of WiFi data. The app gathered and neatly stored the sensor data into a csv file. I didn’t have to massage the data in order to get it in GPS Visualizer.
SensoDuino – https://play.google.com/store/apps/details?id=com.techbitar.android.sensoduino
The same was true for this app, except I had to massage the data to get it in GPS Visualizer. For that reason and the lack of WiFi data, this app got second place.
Sensor Log – https://play.google.com/store/apps/details?id=com.hfalan.activitylog
Finally an app with WiFi data. I really like the interface on this app the most. It lets you log custom sensor groups and assign a button to them to start logging. You can choose a relavent name to give to the buttons. As soon as the app loads, the main view appears with all of the button groups. Pressing a button will start logging. The above apps were combersome compared to this. The real issue I had was the saved data format. It was so much work to massage the data for GPS Visualizer. The effort completely overshadowed the excellent features of the app. I’m hopeful for a new release that will address the saved data formatting issue.
WiFiTracker – https://play.google.com/store/apps/details?id=org.prowl.wifiscanner
I fell on my face during the test. I had issues starting the logging, it wasn’t clear were to begin the logging. I had turned off the default “log when started” option a few days before and forgot. I didn’t want to have it running in that mode. The csv data file created was formatted properly to minimize my need to massage the data. However, I noticed a big problem once the plot rendered in GPS Visualizer, The WiFi plots were all lumped in the same GPS location. This was crap and didn’t cut it for anything worth using. I was able to export the results to kml and view the plots correctly in Google Earth. This added another step to get it into GPS Visualizer. Finally, the app only logs WiFi data, so this is why this app came in last place.
I can’t draw a final conclusion on these apps, I think they all have good qualities that distinguish them from one another. For the purposes of sensor data logging and plotting the top 3 are the ones to pick. If the format issue is addressed on Sensor Log, I would lean more towards that. For the remainder of my presentation tests, I’ll be using the AndroSensor and SensoDuino apps for data gathering for publishing into Thingspeak.
Data presented on the cloud
Thingspeak is a service that will post data online. I was able to import sound level readings from SensoDuino into my CloudACM channel.
The manual data import was no trouble at all, but I really want to find a way to do this automatically. Low and behold, it can be done! I found an Android app that will take sensor readings and upload them to the Thingspeak channel. The app “CloudSensor” has a limited sensor selection, but it does work.
Xively hasn’t been as easy to upload data to. The apps available to do this on Android are sparse and elusive. This is good and bad. It’s good because the technology is new and the potential highest. It’s bad because the wheel hasn’t been invented yet, much of the leg work has yet to be done.
Data overlay using Dashware
I’ve been using Dashware for little over a year now. The program is impressive and I haven’t even scratched beneath the surface yet. I had demonstrated the use of Dashware in my Fall Quarter project. The program is particular about the data you link. That means the csv file will need to be modified to fit with Dashware before it can be used. I had seen demonstrations on how to do this, but for some reason they are no longer available. Below is video of my preset readings using the AndroSensor app earlier this week. I had a tough time getting the data to show up for the sound and speed readings. The GPS readings were even more troublesome. Finally, I had to import the csv readings into GPS Visualizer, then export to a gpx format. Then Dashware had no trouble rendering the data.
Odds and Ends
Something called graphene is being developed to store electrical energy, much like a battery and capacitor. Ultracapacitors aren’t entirely new but I thought I’d post this for some historical reference. Thank you Jim and Cheryl.