InfluxDB and Grafana with Node-Red data from MQTT IoT topics
In this post, I’ll be providing a high level view of IoT data gathering, processing, and presentation. The post won’t contain exact details that may pertain to your needs, but this overview should cover most items to get started.
This video demonstration steps through the process of setting up InfluxDB for use with Node-Red.
It is followed up with another video that continues with Grafana integration with InfluxDB.
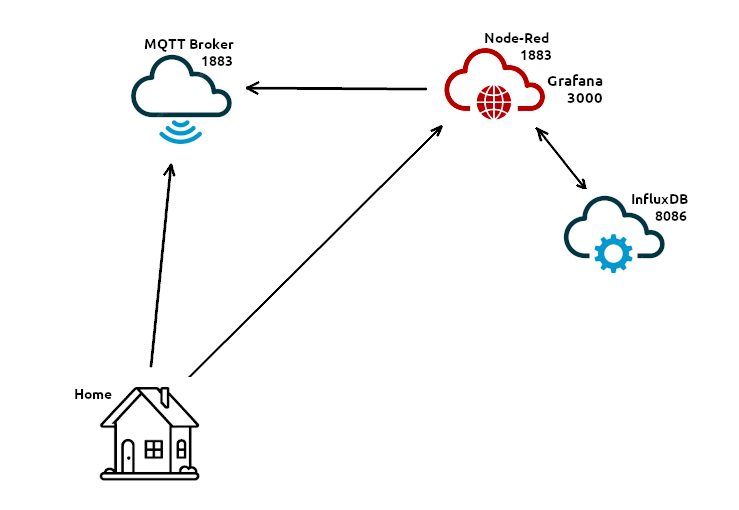
I found these demonstrations to be concise and to the point. IoT devices can publish their data topics to a MQTT Broker. Node-Red can subscribe to those topics and pass them along to InfluxDB. Grafana can query InfluxDB to display the data in a quick and broad way. Here is a simplified diagram view of that environment.
 First we’ll need a MQTT Broker for the IoT device to publish its data to. I used these commands to set up the service on Linux.
sudo apt install -y mosquitto
sudo systemctl enable mosquitto.service
sudo service mosquitto restart
exit
Validating that the services work can be done with these commands on another Linux host.
Subscribe to a topic from the MQTT Broker
mosquitto_sub -h <mqtt-broker-ip-address> -p <mqtt-broker-port> -v -t "Device/Message"

Publish a test topic to the MQTT Broker
mosquitto_pub -h <mqtt-broker-ip-address> -p <mqtt-broker-port> -t "Device/Message" -m "Testing testing 1 2 3"
Next, Node-Red will need to be setup. I used these commands for installation.
sudo apt install build-essential git curl
bash <(curl -sL https://raw.githubusercontent.com/node-red/linux-installers/master/deb/update-nodejs-and-nodered)
sudo systemctl start nodered.service && sudo systemctl enable nodered.service
sudo systemctl status nodered.service
exit
From there, the flows can be created to interface MQTT subscriptions to InfluxDB data buckets. The following command was used to install InfluxDB on Linux.
sudo tee /etc/apt/sources.list.d/influxdb.list<<EOF
deb [signed-by=/usr/share/keyrings/influxdb-keyring.gpg] https://repos.influxdata.com/ubuntu jammy stable
EOF
curl -fsSL https://repos.influxdata.com/influxdata-archive_compat.key|sudo gpg --dearmor -o /usr/share/keyrings/influxdb-keyring.gpg
sudo apt update
sudo apt install influxdb2
sudo systemctl start influxdb && sudo systemctl enable influxdb
sudo systemctl status influxdb
The Grafana installation steps are provided by the Grafana team, https://grafana.com/docs/grafana/latest/setup-grafana/installation/debian/#2-start-the-server.
Hopefully this will provide you with footing on the complex topic of IoT.